
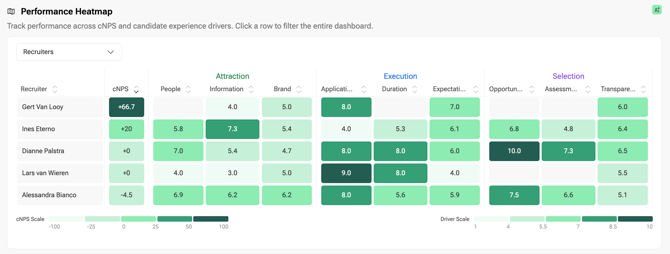
The Performance Heatmap shows cNPS and the nine subdriver scores in one table. Each row represents a person or group, making it easier to compare results and spot strengths and gaps.
Choose what to compare
Use the Heatmap rows selector to choose how to group your results.
Available options include people and teams:
- Recruiters
- Hiring managers
- Team members
- Teams
You can also choose available ATS metadata fields:
- Departments
- Locations
- Application sources
- Application stages
- Job names
- Rejection reasons
The available fields depend on the data your company has. Custom fields are not available as heatmap rows.
By default, the heatmap shows Recruiters, or Team members when a team is selected.
How to read the heatmap
The first score column is cNPS. The remaining columns show the nine subdriver scores, grouped under Attraction, Execution and Selection.
Rows are sorted by cNPS, highest first. Ten rows are shown by default. Select Show all to see more rows or Show less to return to the shorter view.
Each row appears only when there is at least one cNPS answer for that person or group during the selected period.
Understanding the colors
The heatmap uses five shades. Darker green indicates a higher score. The two darkest shades use white text.
The color scales differ for cNPS and subdriver scores.
| Shade | cNPS range | Subdriver score range |
|---|---|---|
| Lightest | -100 to -25 | 1 to 4 |
| 2 | -25 to 0 | 4 to 5.5 |
| 3 | 0 to 25 | 5.5 to 7 |
| 4 | 25 to 50 | 7 to 8.5 |
| Darkest | 50 to 100 | 8.5 to 10 |
A value exactly on a boundary uses the lower color band. Subdriver scores below 1 are treated as 1 for coloring.
Click a row to explore further
Select a row to filter the entire Candidate Experience dashboard to that person or group. This lets you investigate the metrics behind a particular result.
Why some cells are empty
A grey dash means there are no answers to show for that subdriver in the selected period.
This may happen because:
- The surveys sent for that person or group did not include questions for that subdriver.
- Candidates skipped the relevant questions.
- The selected date range or filters leave no answers for that subdriver.
There is no minimum response threshold. A cell based on a single answer can still appear.
The cNPS column is never blank because a row without any cNPS answers does not appear in the heatmap.
Who can see the heatmap?
- Admins: Can access the heatmap.
- Team Managers: Can access it when a team is selected.
- My data: The heatmap is hidden.
- A single team member: The heatmap is hidden, so Team Members cannot use it to break down their own results further.
Recruiter and hiring manager rows depend on the relevant identifiers in your ATS data. If recruiter or employee emails are missing, some rows may not appear.
Good to know
- The heatmap follows the selected data scope, date range and filters.
- Clicking a row filters the whole dashboard, not just the heatmap.
- Enabling Include Discovery adds eligible mapped Discovery rating questions to the relevant subdriver cells.
- Small groups are not hidden. Consider the number of responses when interpreting or sharing results.
See Privacy and anonymity for more information about respondent privacy.