
The Priority Matrix compares your performance on each subdriver with how strongly that subdriver predicts candidates' likelihood to recommend your company. Use it to identify where improvements may have the greatest impact and which strengths to maintain.
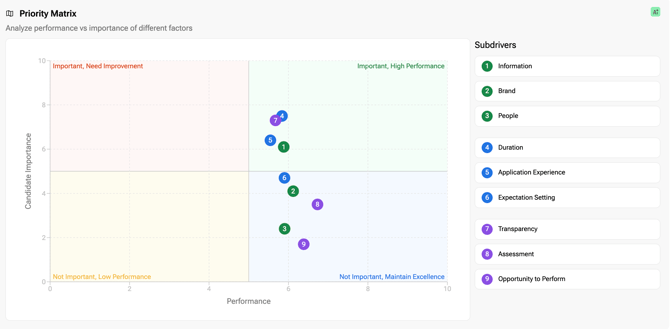
How to read the matrix
The matrix plots the nine subdrivers using two axes:
- Performance (horizontal axis): Your score for each subdriver, based on the selected data scope, filters and date range. Scores range from 0 to 10.
- Candidate Importance (vertical axis): How strongly each subdriver predicts candidates' likelihood to recommend your company. Importance also ranges from 0 to 10.
Each numbered dot represents a subdriver. The Subdrivers legend matches each number to its name, and the dots are colored by driver: Attraction, Execution or Selection.
Both axes use a score of 5 to separate the higher and lower halves of the matrix.
The four quadrants
|
Quadrant |
Meaning |
What to do |
|---|---|---|
|
Important, Need Improvement (top left) |
Matters a lot to candidates but you score low |
Highest priority to improve |
|
Important, High Performance (top right) |
Matters a lot and you score well |
Protect and keep investing |
|
Not Important, Low Performance (bottom left) |
Matters less and you score low |
Lower priority, monitor |
|
Not Important, Maintain Excellence (bottom right) |
Matters less but you score well |
Maintain, avoid over-investing |
The top-left quadrant is generally the best place to start because it highlights areas that matter to candidates but currently score poorly.
How Candidate Importance is calculated
Candidate Importance is based on a machine-learning model that estimates how strongly each subdriver's score predicts cNPS.
The model is retrained monthly using the last 12 months of data. Importance is therefore a snapshot and does not change when you adjust the dashboard's date range or filters.
The model uses one of two approaches:
- Global model: Uses data from Starred customers and excludes demo accounts. It is used when your company does not yet have its own model.
- Company model: Becomes available once your company has at least 30 surveys. For companies with fewer than 2,500 surveys, the company model is blended with the global model. Smaller datasets rely more heavily on the global model.
The model's output is converted to a 0 to 10 scale. A higher score means the subdriver is a stronger predictor of candidate recommendation.
How to use the matrix
- Start with the top-left quadrant, Important, Need Improvement.
- Identify the subdrivers with low performance and high Candidate Importance.
- Review the corresponding subdriver scores and questions to understand what may need to change.
- Use the top-right quadrant to identify strengths to protect.
- Treat the bottom half as lower priority, while continuing to monitor performance.
Good to know
- There is no minimum response threshold for a subdriver to appear in the matrix. With few responses, its performance position can change substantially.
- Performance changes with your selected data scope, filters and date range.
- Candidate Importance is recalculated monthly and does not change with your selected filters or date range.
- Include Discovery does not change the Priority Matrix.
- Candidate Importance indicates predictive strength, not proof that changing a subdriver will cause a specific increase in cNPS.