
The Candidate Experience dashboard breaks the experience score down into three drivers, each made up of three subdrivers. These help you understand which parts of the hiring process are working well and where candidates may be experiencing problems.
The three drivers
Each driver groups three subdrivers that represent different aspects of the candidate experience.
| Driver | Subdrivers |
|---|---|
| Attraction | Information, Brand, People |
| Execution | Application Experience, Expectation Setting, Process Speed |
| Selection | Assessment, Opportunity to Perform, Transparency |
Every standard survey question belongs to one subdriver.
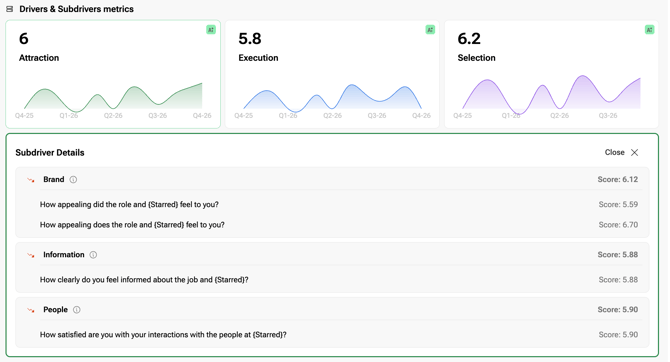
Understanding driver scores
Each driver tile displays its current score and a small trend line showing how the score has changed over time.
Driver scores are calculated by averaging all relevant rating answers across their three subdrivers after converting the answers to a 0 to 10 scale. Each answer counts once, so a subdriver with more answers contributes more to the driver score.
Driver tiles do not include a benchmark line.
If there is no data available for a driver, the tile shows Not enough data to display.
Understanding subdriver scores
A subdriver score is the average of the answers to questions linked to that subdriver, converted to a 0 to 10 scale.
Subdriver scores are shown to two decimal places in Subdriver Details.
For example:
- Information: How clearly and comprehensively information about the job and the company is communicated.
- Duration: How time-efficient the overall process is perceived to be by candidates.
Open Subdriver Details
Select a driver tile to open Subdriver Details. Expand a subdriver to see the individual questions that contribute to its score and the score for each question.
This helps you move from a high-level driver score to the specific questions behind it.

Understanding the arrows
The arrows shown next to subdriver scores compare each subdriver with its corresponding benchmark for the same date range.
- A green upward arrow means the score is at or above the benchmark.
- A red downward arrow means the score is below the benchmark.
These arrows do not compare the score with the previous period.
See Understanding trend charts and benchmarks for more information about how the benchmark works.
Good to know
- All rating answers are converted to a 0 to 10 scale before scores are calculated.
- Scores are pooled across individual answers, rather than averaging each candidate's answers first.
- There is no minimum response threshold before a subdriver score can appear.
- Enabling Include Discovery adds eligible mapped Discovery rating questions to CES, driver and subdriver scores.
- When Discovery is included, subdriver benchmark arrows are hidden because the benchmark does not include Discovery questions.
See Understanding Discovery Questions to learn how to map custom questions and include them in your scores.