
The CES and cNPS cards on the Candidate Experience dashboard include trend charts. These show how your scores change over time and how your results compare with the Starred benchmark.
How to read the trend charts
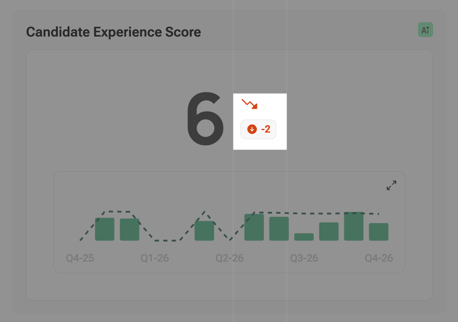
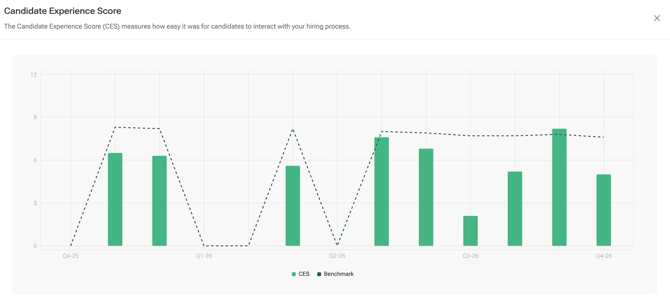
- Bars show your CES or cNPS for each time period.
- The dashed line shows the benchmark for the same period.
- The horizontal axis groups results into time periods, such as weeks, months or quarters.
- Negative cNPS bars appear in red.
Select the expand icon in the top-right corner of a chart to see a larger version with a legend, axis labels and hover details.
How the date range affects the chart
The selected date range determines how results are grouped.
| Selected date range | Bar grouping |
|---|---|
| Up to 45 days | Daily bars, grouped by week on the chart |
| 46–180 days | Weekly bars |
| 181–730 days | Monthly bars |
| More than 730 days | Quarterly bars |
Weekly periods start on Monday. For example, a one-year range shows monthly bars grouped into quarters, while a range longer than about two years shows quarterly bars.
For more details, see Choosing and filtering your data.
Understanding the benchmark
The benchmark is calculated from responses across all Starred customers, including your own company. Demo accounts are excluded, and surveys in test mode are not included.
The benchmark uses the same date range as your dashboard view, but it ignores your other filters and selected data scope.
For example, if you filter your dashboard to the Sales department, your score reflects Sales, but the benchmark still reflects all included Starred customer responses. It does not compare Sales with other Sales departments.
Understanding the score comparison
The comparison indicator on the CES and cNPS cards shows the difference between your score and the benchmark for the same date range. It does not compare your current score with your own previous period.
- A green upward arrow means your score is at or above the benchmark.
- A red downward arrow means your score is below the benchmark.
- The number shows the difference in points. For example, a CES of 7.9 compared with a benchmark of 7.5 shows +0.4.
- If the difference is exactly zero, the indicator is hidden.
Subdriver arrows also compare each subdriver with its corresponding benchmark.
Your own change over time is shown by the bars in the trend charts.
Understanding the headline score
The headline score is calculated using all relevant answers across the selected date range. It is not an average of the bars shown in the chart.
This means the headline score may differ from the simple average of the visible bars, especially when some periods contain more responses than others.
Why a trend chart may show a sudden drop
A chart can show a zero bar for a period with no responses. The benchmark line can also drop to zero for that period.
This may reflect a gap in survey sending rather than a sudden deterioration in candidate experience.
The most recent bar may also be lower or more variable because the period is not yet complete and only reflects the data received so far.
Before interpreting a sudden change as a performance issue, check the date range and whether surveys were sent and answered during the period.
Good to know
- The benchmark includes your own company's eligible responses.
- Other dashboard filters, such as department, recruiter, team and custom fields, do not affect the benchmark.
- The benchmark uses the same date range as your dashboard.
- When Include Discovery is enabled, the CES benchmark indicator and subdriver comparison arrows are hidden because Discovery questions are not included in the benchmark.
- There is no separate industry or region benchmark in this view.